Digital Traces Analyzed
by Nicolas Sacchetti
Digital traces have the potential to analyze and reveal behavioral, economic, industrial and social trends. They are non-traditional data sources.
In the early 2000s, the concept of megadata began to emerge as a set of big data that requires advanced analytical methods to be exploited. Twenty years later, megadata is transforming socio-economic policy and research to serve business management and decision making.
Joseph Domenech is an associate professor in the Department of Economics and Social Sciences at the Polytechnic University of Valencia. As a researcher, he is interested in multidisciplinary approaches to Internet systems and the digital economy.
Domenech gave a videoconference on non-traditional data sources used for economic research at the first 4POINT0 Congress on Policies, Processes, and Practices for Performance of Innovation Ecosystems 2021 (P4IE).
Information and communication technologies (ICT) are in most daily activities. Companies can launch online advertising campaigns, geolocate sales representatives' cell phones, or put sensors in workplaces and on machines.
For individuals, ICT is often used to shop online, give opinions, or follow GPS directions. All these activities leave digital footprints. "When we measure online activities, we have to consider the digital behavior of companies and individuals," Domenech explains.
Classification of Digital Traces
The classification of data sources can be made according to the intention of the users. There are sources that are related to the dissemination of information on websites or Wikipedia pages. Others are related to the interactions of opinion sharing platforms. Some, on web transactions, or sources of data that users have generated without their knowledge, that is, they may not be fully aware of the collection of this data and how it is used. This includes cookies, IP addresses, GPS coordinates of phone calls (Call Detail Records), or data from Wi-Fi accesses used.
Methods for Data Structuring
Since most megadata is unstructured, a process of transforming the data into an organized set is necessary. Domenech presents two methods of data classification. Data Structuring and Modeling Relations.
Data Structuring
Data structuring is a way of arranging data in a database and organizing the links that will allow it to be found.
Relational Model
The relational model is a "model in which data is arranged in a table for which relationships are established between certain rows and columns. It is very popular because it saves memory by avoiding copying the same data into different files (redundancy). In addition, it keeps the data consistent as it only needs to be updated in one file."
NLP
Natural Language Processing (NLP) is a field of research encompassing many techniques to make computers understand texts written by humans. The techniques included in this process are more developed in English than in any other language.
Some Techniques Included in NLP
BoW
The BoW Model (Bag of Words) represents a text by counting the number of times each word appears. 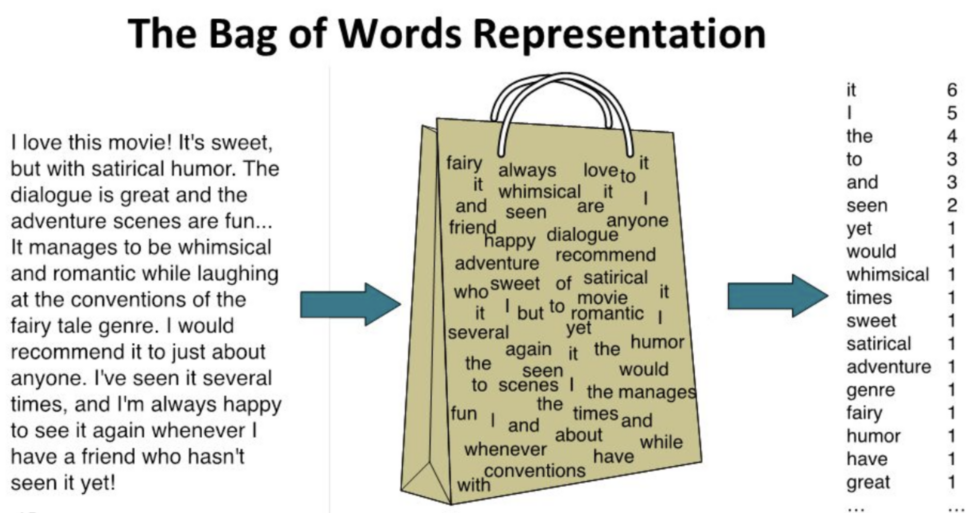
TF-IDF
The TF-IDF (Term Frequency-Inverse Document Frequency) is a "statistical measure that evaluates the importance of a term contained in a document."
Textual Normalization
Stemming and Lemmatization are operations in NLP that aim at reducing words to their canonical form, i.e. their basic form. 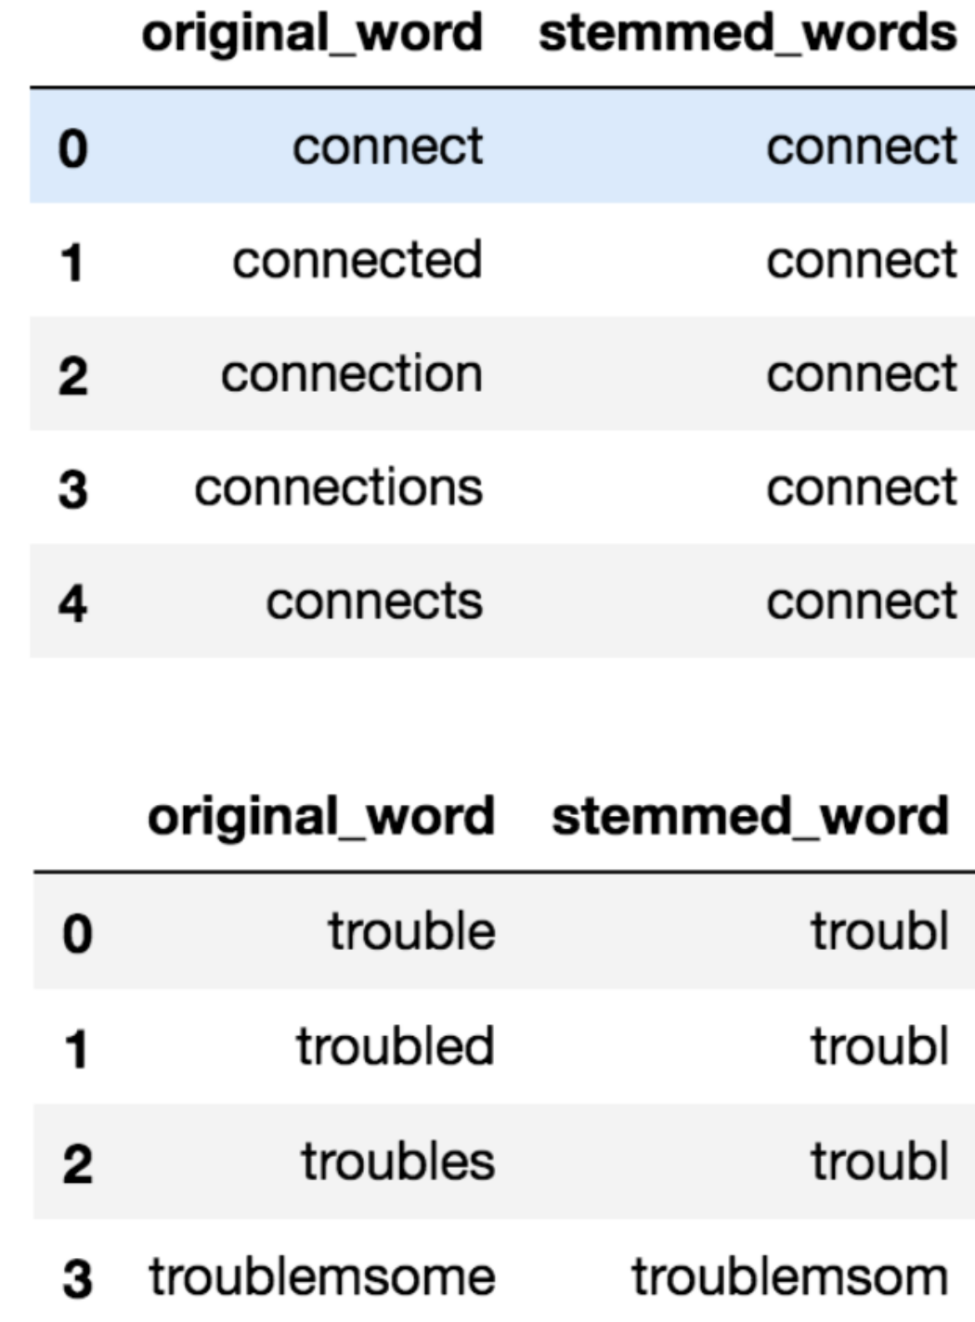 This canonical form allows to represent all words that share the same root or lemma. This allows to normalize the text and to facilitate the comparison between different documents or textual corpora. Radical search consists in removing suffixes and prefixes from a word to keep only its root, while lemmatization aims at finding the lemma, i.e. the canonical form of a word that can be used to represent all its inflectional variants.
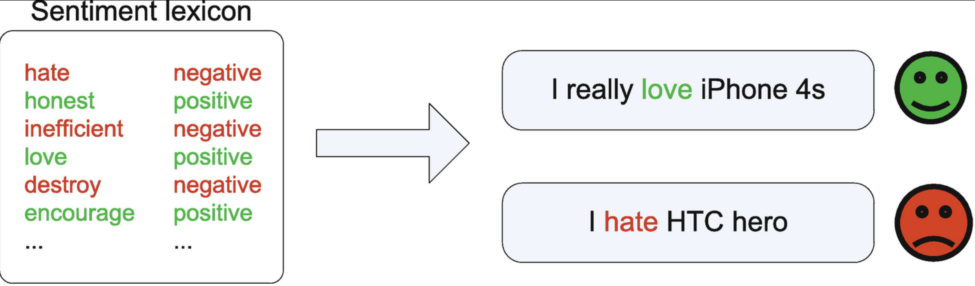
Sentiment Analysis
Sentiment Analysis/Opinion Mining is a text mining technique used to determine the sentiment of Internet users regarding different aspects of a product, an institution, a movie or a political party.
Latent Semantic Analysis
Latent Semantic Analysis attempts to determine the meaning of a sentence based on a set of rules.
Latent Dirichlet Allocation
Latent Dirichlet Allocation "is one of the most popular methods of topic modeling. Each document is composed of several words and each topic can be associated with certain words. The objective is to find the topics to which the document belongs, based on the words it contains. »
Data Match
This technique makes it possible to link information from the same user (or the same entity) across different data sources. A special case is deduplication, which is the elimination of redundant data in a backup system.
Modeling Methodology
There are two models for thinking about modeling. For Supervised Learning, each observation in the data set has inputs and outputs. Inputs are equivalent to independent variables, features, or predictors. The outputs are equivalent to the dependent variables, targets, or responses.
For Unsupervised Learning, each observation has inputs, but no outputs. The goal is to find the relationships or structure between the inputs.
There are other techniques that can be combined to improve the performance of the previous methods: Ensemble Algorithms, such as Bootstrap Aggregating (Bagging), and Random Forest. Regularization methods, such as LASSO, Elastic Net, and Ridge Regression. And Bayesian methods, such as Model Averaging, Bayesian Structural Time Series (BSTS), Spike-and-Slab regression.
Evaluation Methods
The goal of modeling is to obtain a robust model with the best out-of-sample prediction performance. Performance refers to how well the model fits the training data, while robustness refers to how well the model performs with unseen data. However, traditional tests such as R2, AIC, BIC, and Log Likelihood Ratio are not always suitable for dealing with large amounts of complex data (Varian 2014).
An expectation process can help ensure the robustness of the model. To do this, the initial sample is divided into three parts: the training set, the validation set, and the test set. Common approaches for cross-validation are K-fold cross-validation and exclusionary cross-validation.
Optical Readers
Domenech is interested in the Eurostat project in the European Commission's Guide to Statistics in Development Cooperation. The project consists of using data from optical scanners at checkouts of all kinds of businesses such as supermarkets and retailers to measure the consumer price index. This data source also shows interest in new products, and detects consumer boycotts.
« The introduction of barcode scanner technology during the 1970s and its growth in the 20th and 21st centuries has enabled retailers to capture detailed information on transactions at the points of sale. Scanner data(14) is high in volume and contains information about individual transactions or summaries, dates, quantities and values of products sold, and product descriptions. As such, it is a rich data source for NSOs and is more and more frequently used for calculation of consumer price indices (CPI). Scanner data are gathered either directly by the NSOs through agreements with retailers or indirectly from intermediaries or market research companies. »
- Eurostat 2021, Guide to statistics in European Commission development cooperation, p.49
Website
The website of a company is related to its public image. It informs about its products and services, its structure and its intentions. Its function is to inform, to make transactions, and to facilitate the sharing of opinions. Domenech explains that all this information is used to analyze a company's behavior.
Analysis
The behavioral analysis of Internet users who browse a site is done by considering the unique visitors (page views) on the different pages. Web analytics also allows this study.
In terms of analyzing the content of pages, one strategy is to define keywords and count the number of times they return to the page. "For example, if we want to know how many companies are working on a particular technology, we can define that keyword and try to find it on their website. It's a quantitative measure of the intensity that this technology has in different companies," Domenech says.
Other approaches are possible when it comes to analyzing the content of web pages. NLP can tell us what languages are available, what topics are being discussed, and whether there are courteous and positive exchanges between individuals on these web pages.
At another level of analysis, the HTML code describes the content of the page. It gives information about the technology used to code it. A website with depreciated functionality is interpreted as belonging to a company whose economic value is declining.
Site-level analysis analyzes the site as an entity. "We analyze the site's link structure as a network analysis. We can see how the site is connected to other players in the innovation ecosystem," says Domenech.
Also, in order to see the evolution over time and appreciate the innovation achieved by a company, the Wayback Machine allows to view previous versions of websites.
Social Networks
The information they contain is, to some extent, a reflection of what is happening in society. The most popular microblogging service is Twitter. Twitter data is used to conduct economic and social science research. Whether it is to describe political preferences and predict election results, predict stock market movements, predict movie industry entries, or monitor public opinion on new policies. The orientation of social networks towards a segment of the population requires the use of certain statistical measures of correction when making these predictions.
Of course, companies use social networks to announce new products and services. Product innovation can be reflected in what is presented there, as well as the interaction between different actors in the innovation ecosystem can be analyzed.
Search Engines and Google Trends
Google Trends allows to measure people's interest in new products or services in real time (random sample of the last seven days), or in delayed time (random sample of the dataset from 2004 to the last 36 hours). Google Trends provides a Search Volume Index (SVI). This allows to know the trends of the popularity of the subjects, but it is difficult to compare countries or regions due to the absence of absolute data (module - math).
Josep Domenech concludes with these words: "Digital data offers many possibilities, but also poses many challenges. We have to change data management systems, and we have to learn new methods of analysis, because digital data has changed the traditional ways of doing things. These new approaches require a multidisciplinary perspective. We need teams of professionals who manage the data, who have the knowledge of the sources, and who know how to interpret it. »
This content has been updated on 2023-03-14 at 18 h 08 min.